Configurations in ~/.gnuplot
現在は Linux Mint 18.1 にて gnuplot 5.2 patch 2 を使用しています. ホームディレクトリに ~/.gnuplot を作成して起動時に以下のコマンドを実行しています.
# gnuplot startup script
set terminal wxt font 'Ubuntu,14'
set colorsequence podo
set timefmt "%Y-%m-%dT%H:%M:%S"
set encoding iso
set bar 0
set xyplane 0.05
set colorsequence podo を実行することで色覚の多様性を考慮に入れた配色パターンが採用されます. もちろん, 色だけでなく線種やシンボルの形状でも見分けられるようにするべきですが, デフォルトで podo を採用しておいて悪いことはないと思います.
他には timefmt を ISO 8601 拡張形式に指定, キャラクターコードを ISO-8859-1 に指定, エラーバーの上下のひげを削除, 3 次元プロットしたときに空間を有意義に使えるように \(x\)y-plane の値を調整, といった設定をしています.
また, これ以外にもいくつかの関数を定義して使用しています.
Color settings
gnuplot で rgb(r,g,b) あるいは hsv(h,s,v) で色指定をするための補助関数を定義したスクリプトです.
### convert (r,g,b) to #RRGGBB
rgb(r,g,b) = sprintf("#%02x%02x%02x",int(r)%256,int(g)%256,int(b)%256);
### convert (h,s,v) to #RRGGBB
hsv_hi(h) = floor((int(h)%361)/60.)%6
hsv_f(h) = (h/60.)-floor(h/60.)
hsv_p(s,v) = floor(v*(1.-(s/255.))+0.5)
hsv_q(h,s,v) = floor(v*(1.-(s/255.)*hsv_f(h))+0.5)
hsv_t(h,s,v) = floor(v*(1.-(s/255.)*(1.-hsv_f(h)))+0.5)
hsv(h,s,v) = hsv_hi(h)==0?rgb(v,hsv_t(h,s,v),hsv_p(s,v)):\
             hsv_hi(h)==1?rgb(hsv_q(h,s,v),v,hsv_p(s,v)):\
             hsv_hi(h)==2?rgb(hsv_p(s,v),v,hsv_t(h,s,v)):\
             hsv_hi(h)==3?rgb(hsv_p(s,v),hsv_q(h,s,v),v):\
             hsv_hi(h)==4?rgb(hsv_t(h,s,v),hsv_p(s,v),v):\
             rgb(v,hsv_p(s,v),hsv_q(h,s,v))
###
RGB function
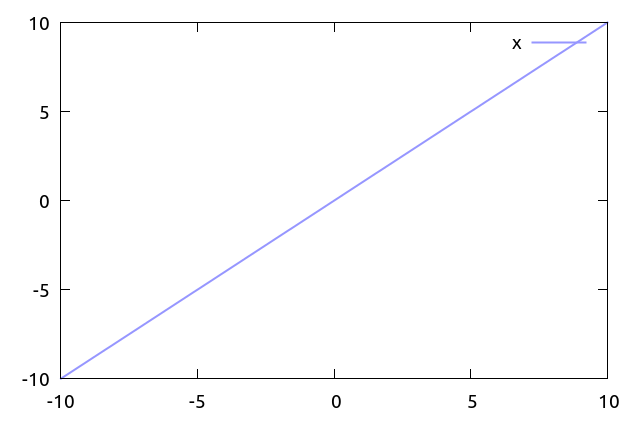
関数 rgb(r,g,b) は r, g, b にそれぞれ 0..255 の整数をとる関数です. (r,g,b) の組で指定された色を 16 進数の #RRGGBB 文字列に変換します. line color に指定する際には以下のように使用します.
plot x w l lc rgb rgb(150,150,255)

HSV function
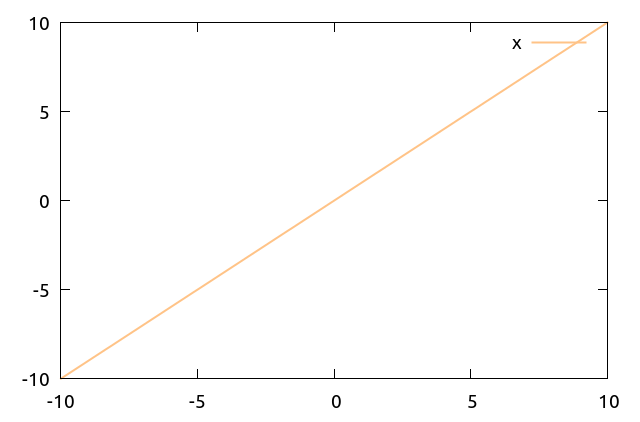
関数 hsv(h,s,v) は h に 0..360 の整数, s,v にそれぞれ 0..255 の整数をとる関数です. (h,s,v) の組で指定された色を 16 進数の #RRGGBB 文字列に変換します.
plot x w l lw 2 lc rgb hsv(30,120,255)

Viridis colormap
Python の matplotlib などで使用されている viridis というカラーマップをインポートしています. viridis は Berkeley Institute for Data Science によって提供されているカラーマップのひとつです. gnuplot で読み込めるように形式を変換したファイルが [gnuplot-palettes][plattes] で公開されています. viridis.pal をダウンロードして load しています.
Mathematics
max/min functions
2 変数のうち大きい方 or 小さい方を返す関数です. 三項演算子を使えばいいですが記述がシンプルになるので定義しています.
min(x,y) = ((x<y)?(x):(y))
max(x,y) = ((x>y)?(x):(y))
log2(x)
log(x), log10(x) は定義されていたのでなんとなく.
log2(x) = log(x)/log(2.0)
Random variable
Box-Muller 法を使用して正規分布に従う乱数を生成する関数です.
# random variable from a Normal distribution
randn(u,s) = u + cos(2*pi*rand(0))*sqrt(-log(1-rand(0)))*s
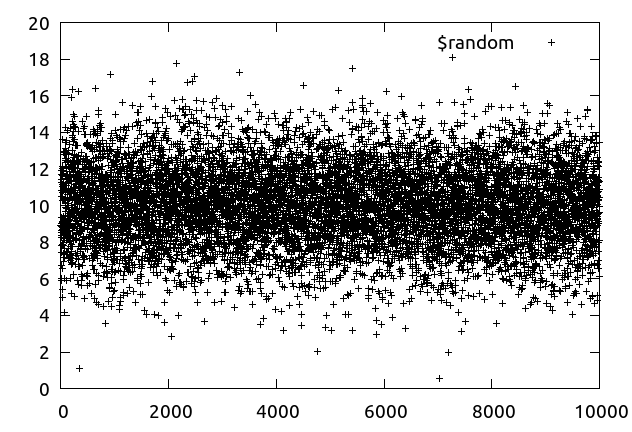
以下では datablock を使用して定義したデータ列 $random を表示しています.
set print $random
do for [n=0:1000] { print randn(10,3) }
set print
plot $random

Astronomy
Blackbody function
黒体輻射を定義しています. blackbody_nu(nu, T) は周波数 (Hz) と温度 (K) を引数にとる関数です. flux density は Jy 単位で与えられます. blackbody_lam(lambda, T) は波長 (µm) と温度 (K) を引数に採る関数です. flux density は W/m2/µm/str で与えられます.
astro_h  = 6.626068e-34   # planck constant
astro_kB = 1.3806503e-23  # boltzmann constant
astro_c  = 2.99792458e8   # the speed of light

jansky_to_watt(nu, f) = \
  f*(nu**2/astro_c)*1e-6  # in units of W/m^2/um/str

## Blackbody function in units of Jy
blackbody_nu(nu, T) = \
  2.0e26*(astro_h/astro_c**2)*(nu**3)/(exp(astro_h/astro_kB*nu/T)-1.0)

## Blackbody function in units of W/m^2/um/str
blackbody_lam(lambda, T) = \
  (lum=1e-6*lambda,jansky_to_watt(astro_c/lum,blackbody_nu(astro_c/lum,T)))
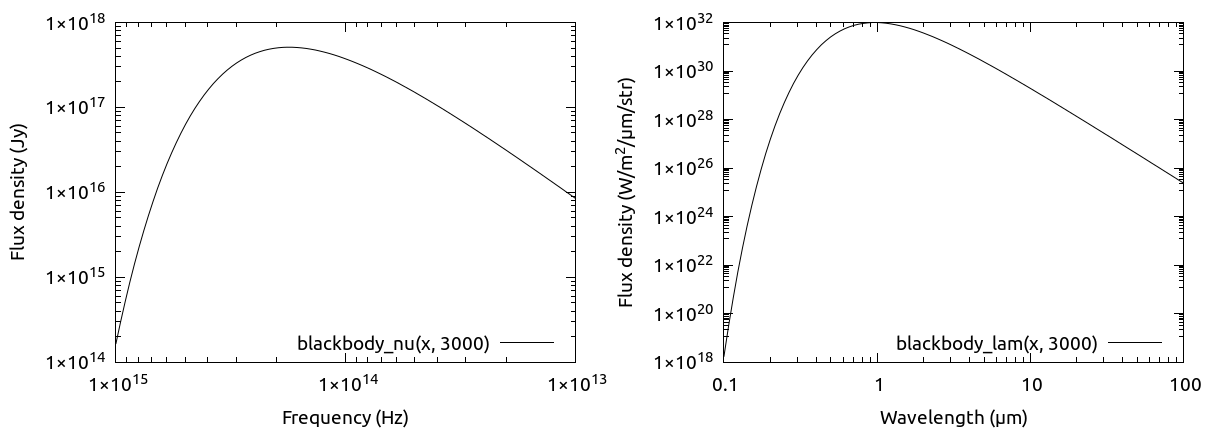
それぞれの関数の使い方を以下のサンプルに示しました.
set log x
set log y
set key bottom right
set multiplot layout 1,2

set xr [1000*1e12:10*1e12]
set xlabel "Frequency (Hz)"
set ylabel "Flux density (Jy)"
plot blackbody_nu(x, 3000)

set xr [0.1:100]
set xlabel "Wavelength ({\265}m)"
set ylabel "Flux density (W/m^2/{\265}m/str)"
plot blackbody_lam(x, 3000)

unset multiplot
